Not Just In My Head
One of the most aggravating things about high blood pressure issues is the knowledge that stress makes it worse. The result is this vicious cycle where the reading is high, then you start stressing about the pressure, and it gets worse from there.
The way I deal with this is to take multiple measurements over the course of a few minutes, because once you have the first measurement you can start doing relaxation exercises, and be pretty sure the numbers aren’t going to get any worse. That gives you a range of numbers, which you can average together for each day.
Now, I’ve been tracking my blood pressure at home more or less since November and recording it using this handy blood pressure logging app (you have to pay a bit for the fancy ad-free version). Perhaps stupidly, I took a lot of December off while I was sick, and I’ve omitted some of the most crazy extreme of measurements (for example ones taken when I’ve just sat down after climbing the stairs), but when you chart it out, it does look like there’s a genuine upwards trend going on (red and green lines):
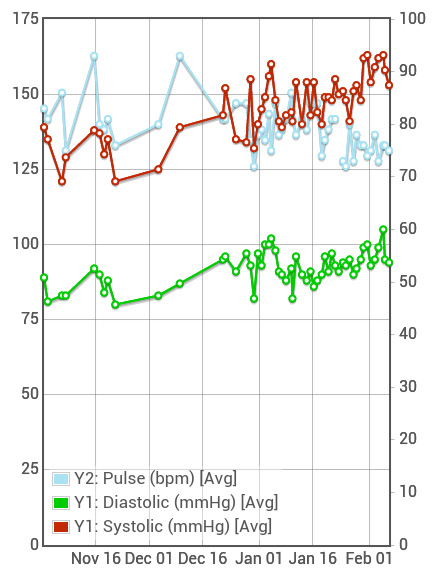
AVERAGE blood pressure (number scale on left, red and green lines) and pulse measurements (scale on right, blue line) per day.
The docs and midwives seem to mostly care about the lower (diastolic, green) number, which should lie in the 90-95 range, with above 105 being ‘bad’.
Now, December 21 was when the diastolic (lower number) went over 100 for the first time (see chart below). January 4 was when I got a teeny tiny bit of blood pressure medication (1 pill per day), and January 7 was when the dosage was upped to 3×1 pills per day. As of yesterday (Feb 5) I’m on 3×2 pills a day.
One can see that things were getting a bit out of hand there at the beginning of January, but that the medication brought the numbers down. Even then, there’s an upwards trend all through January, which makes me think that this isn’t just something in my head – this appears to be a ‘real’ physical reaction to the pregnancy. Perhaps ‘pregnancy-induced hypertension‘ isn’t a misnomer after all…?
It’s also pretty easy to see that the medication has lowered and stabilized my pulse.
Here are the minimum and maximum values for each day:
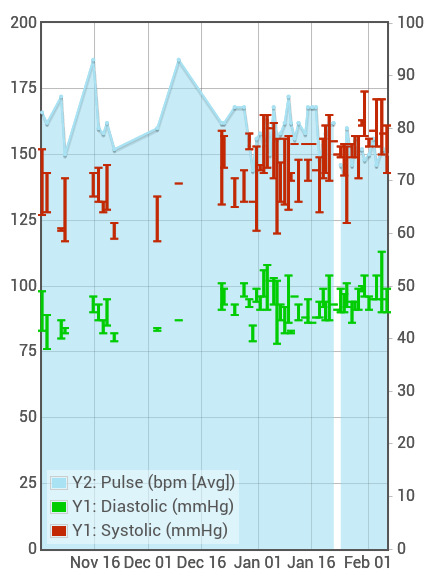
The min and max values for each day in the previous plot. I usually take about three measurements per day. Most often it is lying down, before getting out of bed, and thus also before taking my morning pills.
The biggest change seems to be that there are no really low measurements after the medication started, and the peaks are getting higher as time passes…
So yeah, this whole thing is probably coming to a close fairly soon, but meanwhile, I’m hanging out in my pillow fort! 🙂

My pillow fort! 🙂